MOPS: Finding things that go bump in the night

July 7th, 2011 by

You’ve seen the Hollywood movie version, an astronomer looks through the eyepiece of a telescope (it’s always got an eyepiece), scribbles some calculations on a piece of paper and, with a look of horror flashing across his face, realizes that this is the one, the deadly asteroid that’s going to hit the Earth. In reality discovering asteroids that may threaten the Earth is nowhere near as sensational. But it is somewhat more complicated than and equally as fascinating as the movie version.

Pan-STARRS1’s 7.0 square degree field of view makes it an excellent tool for finding objects moving around our own solar system. Part of PS1’s mission is to discover and catalog these hazardous near-Earth objects (NEOs) and their even more dangerous cousins, potentially-hazardous objects (PHOs). NEOs have orbits that bring them within 0.3 AU (about 45m km) of Earth’s orbit, while PHOs have orbital paths that bring them within 0.05 AU (~7.5m km) of Earth’s orbit and are at least 150m in diameter, large enough to cause extensive damage if one were to collide with the Earth.

To cope with the volume of asteroid data that PS1 and an eventual Pan-STARRS 4 (PS4) would need to handle, the Pan-STARRS project devised its own asteroid-finding software, called MOPS: the Moving Object Processing System. MOPS has been under development for about 6 years, and has proven adept at finding NEOs in Pan-STARRS data and in managing its own catalog of newly discovered and known asteroids beside NEOs so that PS1 scientists can do solar system science.


ASTEROIDS
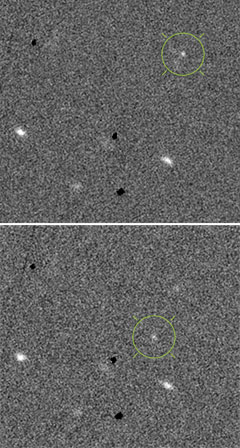
Potentially Hazardous Object ST3 shown moving between two Pan-STARRS images.

By far the largest population of asteroids known lie in the Main Belt between Mars and Jupiter. There are currently about 500,000 known Main Belt Objects (MBOs), a number that increases by a few thousand each month. Occasionally an MBO travels close enough to Jupiter that Jupiter alters the MBO’s orbit so that the MBO transitions to a different orbit. This can be a much more elliptical orbit that sends the MBO well into the inner solar system. If this new orbit brings the MBO close to the Earth’s orbit, it is classified as an NEO. Asteroids range from as large as 950 km in diameter for Ceres (the first asteroid discovered) down to as small as a bus or even a basketball. The smaller asteroids are much more numerous though — while a 1-km asteroid might hit the Earth every million years, a rock the size of a basketball collides with the Earth about once a day.


HOW MOPS FIND ASTEROIDS

Asteroids are first discovered as star-like dots moving between astronomical images taken at the same place on the sky. On short time scales, say less than a day, most asteroids move in a fairly straight line. MOPS uses special spatial-searching software to detect asteroid candidates by playing a large game of dot-to-dot with the millions of star-like sources found in PS1 imagery. PS1′s image processing pipeline (IPP) automatically removes stars, which aren’t moving, so MOPS has the job of trying to find straight-moving combinations of sources in the remaining “transient data” catalogs. We call these nightly associations of asteroid detections tracklets. A large part of the task of finding tracklets is dealing with false sources — star-like image features that come from image artifacts, cosmic rays and random fluctuations in the pixel data. Each night, MOPS scans its transient catalogs for asteroid candidate trackelts, and an IfA scientist confirms real asteroids in each nightly list of candidates.

PS1′s survey designed so that asteroids can be discovered while meeting other science objectives. For example, the PS1 “3π” all-sky survey always obtains images in pairs, so that we can tell if a star-like source is in fact an asteroid because we see it moving between two or more images. About 85% of PS1′s survey time can be used to discover asteroids.


ASTEROID ORBITS

From a single night of observations MOPS cannot determine the complete orbital description of an asteroid. Note that while an asteroid has a straightforward elliptical motion through the solar system, its motion on the sky can be rather complicated due to projection effects. Also, from initial observations we cannot tell how far away an asteroid is from us — we only know its brightness, which can vary according to size and distance. So a faint asteroid might be small or far away; we can’t tell at first.

In order to compute a full six-parameter orbit which describes an asteroid’s motion through the solar system, we need multiple nights of observations of an object, then employ a computational procedure called orbit determination. PS1 uses software provided by NASA’s Jet Propulsion Laboratory — the same software used to guide spacecraft through the rings of Saturn! — and the OrbFit Consortium to fit orbits of solar system bodies to PS1 observations.


FINDING NEOS

Discovering NEOs is even more challenging because they can be found all over the sky, often moving quickly. Unlike main-belt asteroids, which are mostly a similar distance from the sun (2-3 AU) and lie in the plane of the solar system, causing them to appear in a “stripe” on the sky, NEOs can be whizzing by quite close to us and can therefore be projected anywhere on the sky. Repeated PS1 detections of these objects can be quite far apart, and making the dot-to-dot associations more difficult. Because PS1′s survey is largely preprogrammed, PS1 cannot always “chase” fast-moving NEOs to obtain repeated observations. So when we discover a candidate NEO tracklet, we submit the observations to the IAU Minor Planet Center, which maintains lists of NEO candidates that need additional observations. PS1, with its wide field, excels at finding initial observations of new NEOs, but prompt follow-up requires worldwide teamwork and cooperation.
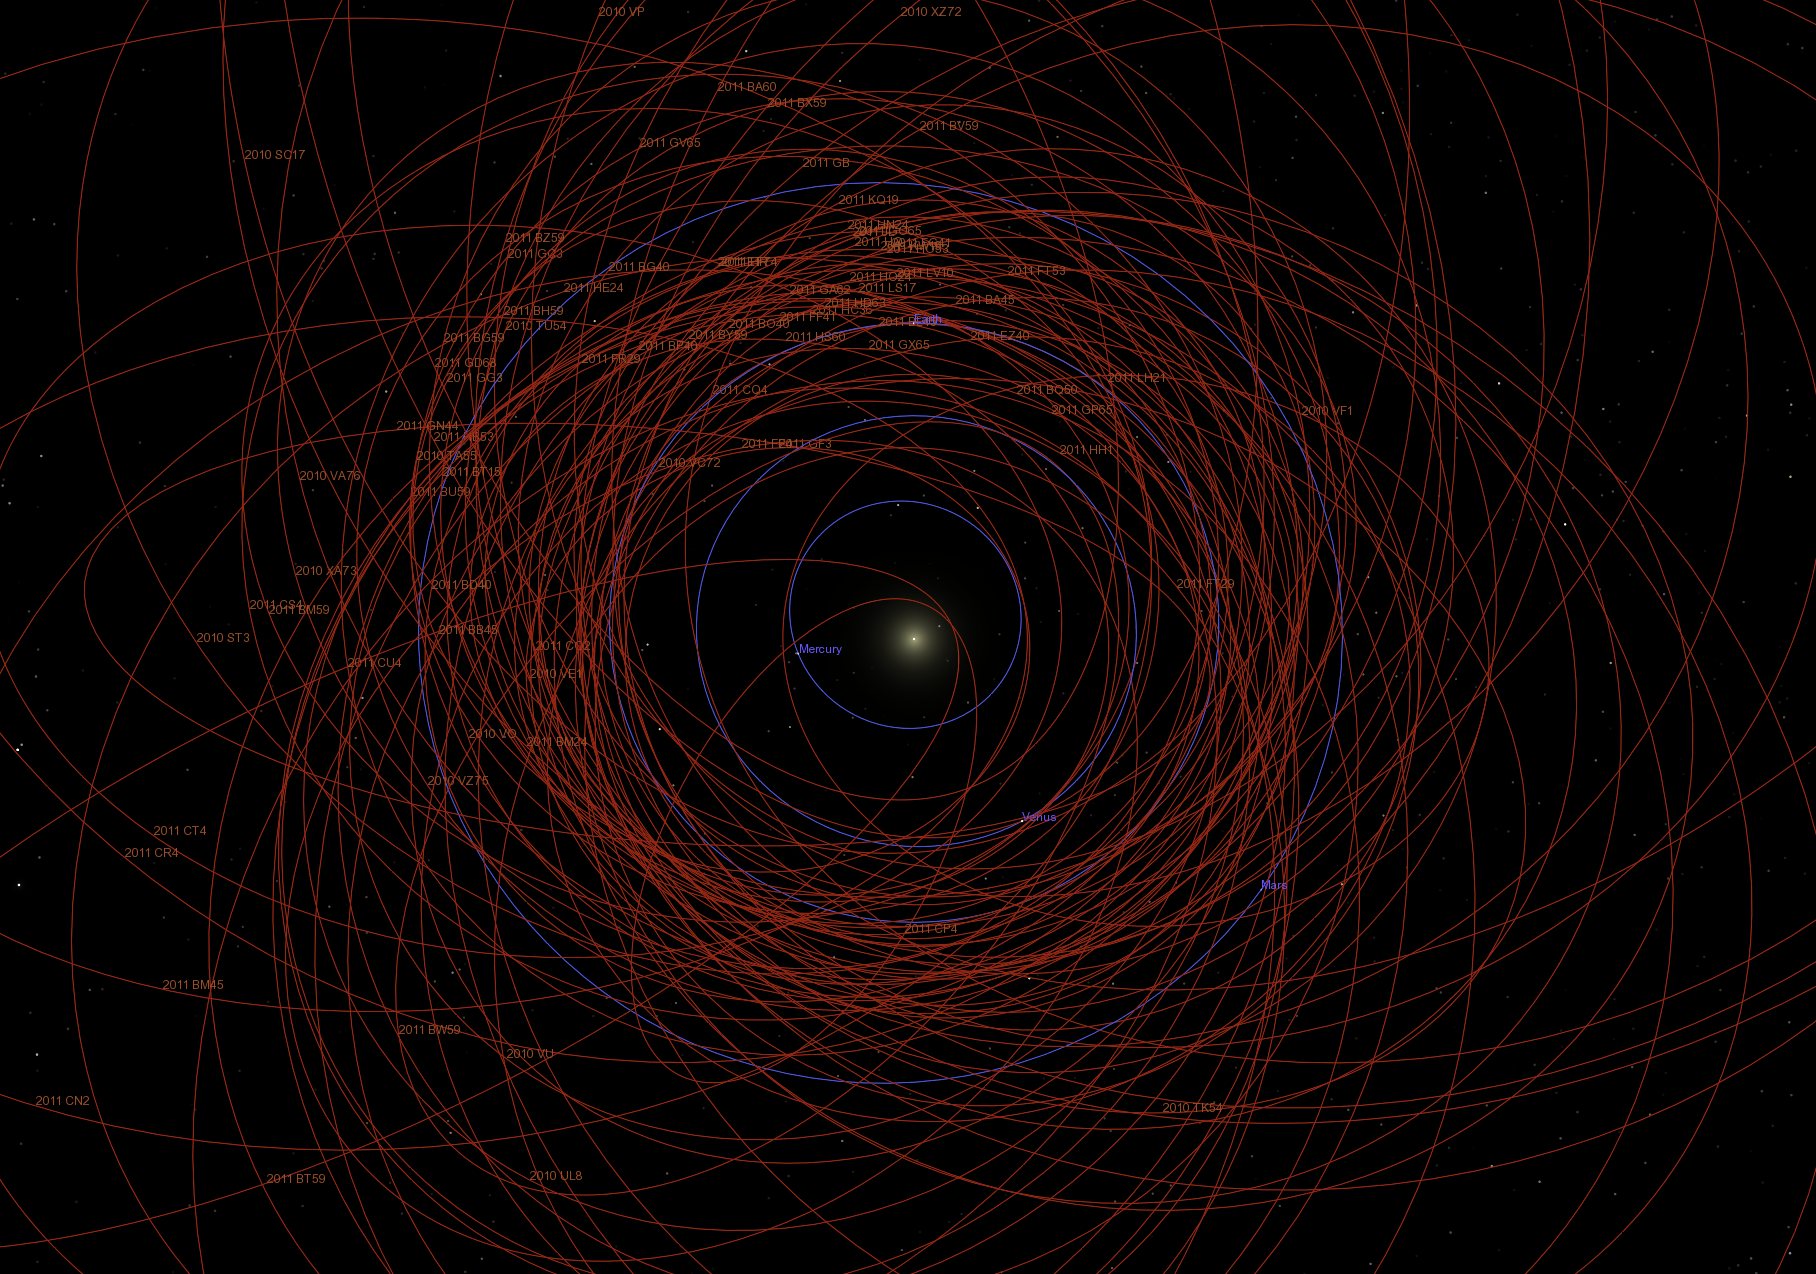
 

Diagram of the solar system seen from above, showing orbits of NEOs discovered by PS1. Click for large version.

PS1 DISCOVERIES

To date PS1 has discovered 85 new NEOs, two comets, and about 4000 main-belt asteroids. PS1 has also submitted observations for over 200,000 known asteroids — nearly half of all known asteroids! This is an important contribution because PS1′s position measurements are so precise that they substantially improve the accuracy of orbits for known asteroids, allowing us to know their positions even better. Here are some highlights of PS1 discoveries:

2010 ST3. PS1′s first NEO discovery from September 2010.

2011 BT15. An especially hazardous NEO, since we cannot yet rule out an impact in the future between years 2037-2110. JPL maintains a list of still-worrisome asteroids at their risk page.

C/2011 L4. Long-period comet on its way toward the sun from the icy reaches of the outer solar system. This object should be visible to the naked eye in early 2013. PS1SC scientist Richard Wainscoat has more information about C/2011 L4 in another blog post.


OTHER SOLAR SYSTEM SCIENCE

There’s alot more to the solar system than just NEOs and MBOs though. PS1SC scientist Darin Raggozine posted a great summary of outer solar system research, and there’s currently research into newly discovered main-belt comets, “contact binary” asteroids that are fused together, and asteroid impacts. When there’s exciting news to report you can be sure to find it on the PS1SC blog.

The IPP: from Summit to Science

February 14th, 2011 by

With a 1.4 billion pixel camera, and a mission to cover as much of the sky as often as possible, it’s easy to see why the Pan-STARRS 1 survey produces a lot of data (enough to fill a thousand DVDs each night). But how does this avalanche of raw images get transformed into something useful for real science? The answer comes in the form of the Image Processing Pipeline (IPP), a key Pan-STARRS subsystem that has the unenviable task of storing, processing and distributing data to scientists around the world.

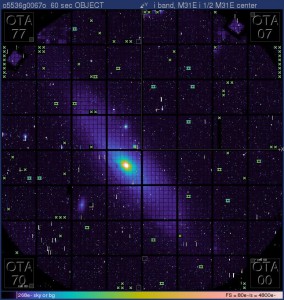
A raw exposure of the type processed by the IPP. This image is of the Andromeda spiral galaxy (M31). Each Pan-STARRS image is comprised of 60 separate CCD chips, themselves made up of 64 individual cells 600x600 pixels in size. Credit: PS1SC

The data volumes are huge: an average of 500 images are taken each night, each nearly 1.5Gb in size. Once copied over fiber-optic cable from the summit of Haleakala, processing begins using a cluster of 87 computers at the Maui High Performance Computing Center (MHPCC). Because the IPP needs to keep a backup copy of all raw images, as well as producing products from each, a huge storage capacity is required. Currently, over a petabyte of storage is available - enough to store 13 years of high-definition video.

The early stages of the pipeline clean the raw exposures and catalog the detections recorded in each frame. A detection is anything that stands-out over the background of the sky, and so most are the result of light from stars and galaxies. But there are also a variety of non-astronomical detections that must be filtered out of the data, including those arising from imperfections in the camera, passing satellites, even exotic events like cosmic rays.

One method to minimize the effects of camera faults is the use of dark frames. These are images taken with the camera shutter closed, and are essentially photographs of the imperfections that will ultimately show up in all images. Dark frames, usually taken before observations begin for the night, are used to subtract away these unwanted features from the actual science images taken later.

Other unwanted detections are harder to remove. Cosmic rays, for example, are high energy particles from distant space that hit our detector an average of 2000 times per exposure, and have a bad habit of looking like astronomical objects, such as comets. Sophisticated algorithms are used to weed these out, with every detection given a likelihood of being a star, galaxy or cosmic ray. For bright detections, these likelihoods are very accurate, but at the fainter end the error margins increase.

As well as nice clean images of the night sky, the IPP must also catalog the properties of the astronomical objects detected in each image. Broadly speaking, this breaks down into astrometry and photometry. Astrometry is the measurement of the positions of objects on the sky, whereas photometry is the measure of their relative brightnesses. It is this information that will ultimately make up the Pan-STARRS Survey Catalog, with accuracy improving over time as more and more sky coverage is obtained.

With images cleaned, and detections cataloged, the end result of this first part of the pipeline is what we call warps. These images have been adjusted to the coordinate system of the sky, rather than the camera. Warps are then used in combination to create new images, such as diffs and stacks.

Each night, PS1 takes pairs of images of the same part of the sky an hour or so apart. This enables the IPP to hunt for transient objects. Transients are objects that either change in position or brightness over time. Asteroids and comets are examples of the former and supernovae (exploding stars) of the latter. By taking the image pairs, and subtracting them one from the other, features common to both (the static stars and galaxies) are removed, while the transients remain. These diff images are the main product of interest to the Moving Objects Pipeline (MOPS) subsystem, which uses them to locate objects that may be on a collision course with the Earth.

Other scientists are interested in the static sky, and for this, the deeper the better. Pan-STARRS’ sensitivity means that it can see very faint objects in every frame, but extra depth can be obtained by adding together, or stacking, images taken of the same region of sky. Contrary to diff images, stacks remove all transient features, while also reducing image noise (random variations across the image) and strengthening the signal of the real astronomical detections. This is what is meant by improving the ‘signal-to-noise ratio’, and helps reveal objects that may have been unnoticeable in the single exposure frames. The more images that are combined, the deeper the resultant stack and the fainter the objects that can be resolved. Ultimately, when the Pan-STARRS survey is complete, the IPP will produce stacks for the whole observable sky.

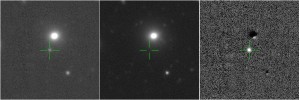
Now you see it, now you don't: Three images of a supernovae candidate.The first image shows a single frame exposure, with the object faintly visible. The second is a stack image, with all transient features removed from the field, so the supernovea cannot be seen. The third is a difference image of the first two, which clearly shows the bright exploding star (pictures courtesy of Queen's University Belfast, SN candidate 1100316261032829600). Credit: PS1SC

With near-Earth space increasingly littered with man-made objects, such as communications satellites, discarded old rockets and other space junk, our view of distant space is often obscured. These objects, which are relatively close to us, appear to move very fast relative to the distant stars and so appear in PS1 images as streaks across the frame. Because some of these streaks can potentially reveal information regarding the origin, as well as potential payload, of satellites, they are regarded as sensitive information by the United States Air Force, who funded the building of PS1. For this reason, one of the last stages of the IPP is to remove these streaks from all images released to consortium scientists.

While other PS1 systems have a chance to rest during daylight hours, the IPP marches on. Due to its commitment to process each night’s data while simultaneously reprocessing older data with improved analysis software, the IPP works continuously. Tools are available for staff to monitor the load on the computer cluster, and to track the progress of each processing strand as it moves through the system. Different types of observation are given different priorities. For example, data for the MOPS system is high priority due to the time-critical nature of the potential discoveries of asteroids, which must be promptly followed-up by other telescopes for confirmation.

But regardless of survey, the IPP must, at the very least, complete processing of all new data before the following night’s observations begin. To slip behind would be disastrous, as only bad weather, or technical issues at the summit, will slow the data flow.

As the volume of data grows over the coming years, the IPP will be under greater and greater strain, but additional computer hardware, as well as inevitable software changes, should ensure that it is able to keep up with demand, and continues to publish valuable data to scientists around the world.